NicheMapR: Software suite for microclimate and mechanistic niche modelling in the R programming environment.
Overview
NicheMapR is a suite of programs for the R environment that compute fundamental physical and chemical constraints on living things. It aims at asking the general question: Can an organism complete its life cycle in a particular place and time, without overheating, desiccating or starving?
In other words, starting with the functional traits of an organism, the programs can be used to determine the environmental sequence experienced by an organism in a particular habitat and assess whether this sequence is inside, or outside, of its niche.
To achieve this it integrates:
- calculations of the external processes of heat and water exchange using the principles of biophysical ecology
- calculations of internal processes of growth, development and reproduction, i.e. metabolism, using the principles of metabolic theory (Dynamic Energy Budget theory)
- calculations of the microclimates to which the organism is exposed using principles of micrometerology, soil physics and hydrology.
Michael Kearney introduces NicheMapR
Michael Kearney introduces R Shiny apps for NicheMapR
Background and History
NicheMapR started as a project on why desert iguanas change colour. Learn more here.
Applications
To see examples from the literature that have applied NicheMapR, click here.
Tests
The algorithms underlying NicheMapR have been subjected to a range of tests as described in the papers here.
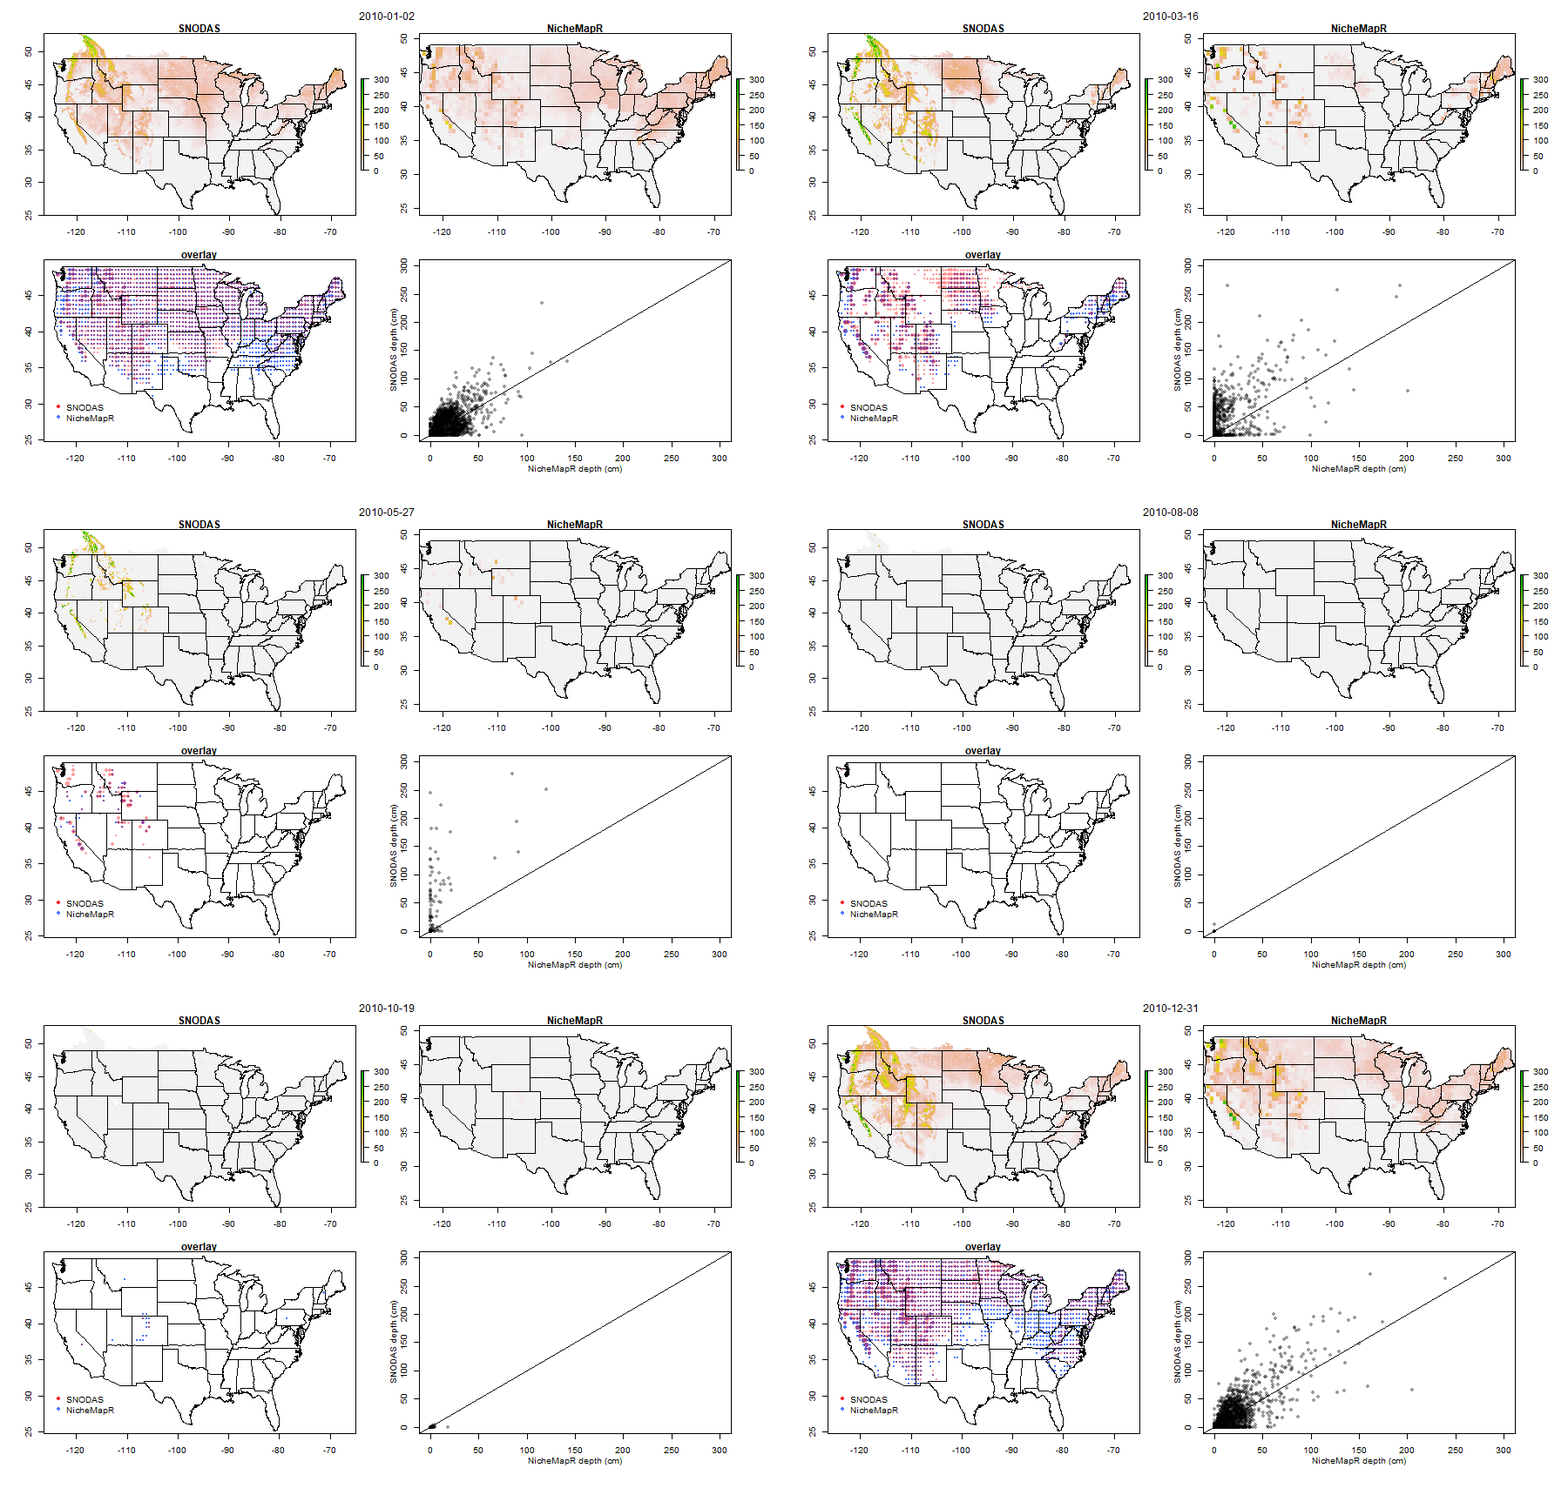
- Snow model test from Kearney, M. R. (2019). microclimUS: hourly estimates of historical microclimates for the United States of America with example applications. Ecology, 0(ja), e02829. doi:10.1002/ecy.2829

Sample comparison of SNODAS and NicheMapR predictions of snow depth in 2010, showing (top left) SNODAS prediction, (top right) microclimUS prediction, (bottom left) prediction overlap (i.e. only showing SNODAS points coinciding with microclimUS points, the size of points represents relative depth of snow for each data set) and (bottom right) correlation.
